
The easiest reversal pattern to recognize.
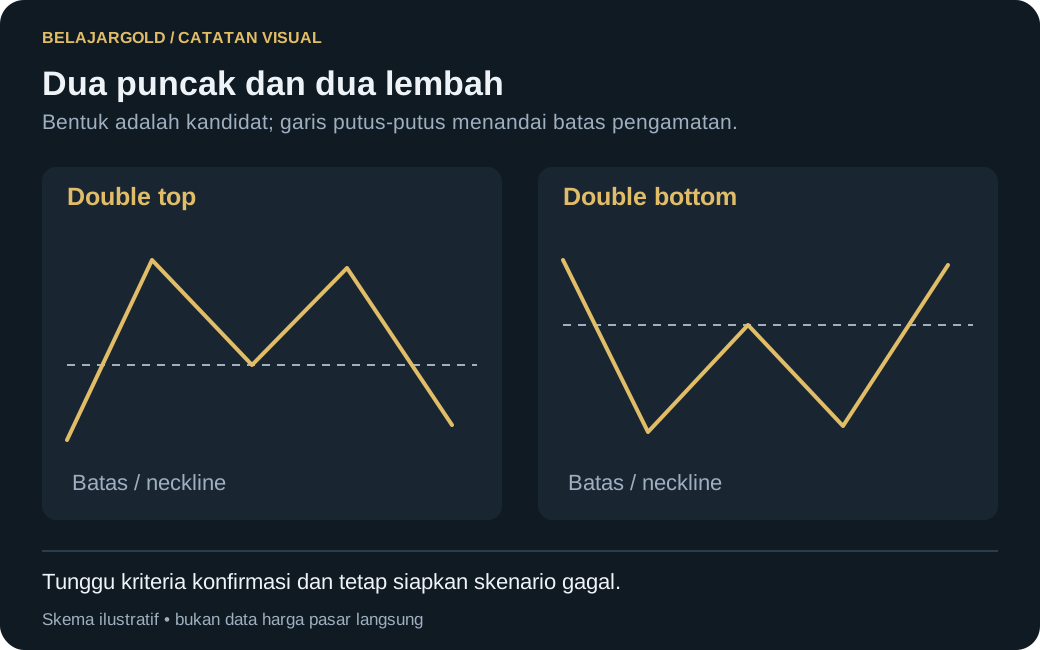
Double top
- Two highs at a similar price level, separated by one low (the neckline).
- Appears after an uptrend. Shows that buyers failed to make a higher high.
- Trigger: price breaks and closes below the neckline.
- Stop: above the second high.
- Target: the height of the pattern (high → neckline) projected downward from the neckline.
Double bottom
The mirror image: two similar lows after a downtrend, triggered when price breaks above the neckline.
Key points
- The highs/lows do not have to be exactly equal — a close range is enough.
- Confirm with a close through the neckline, not just a touch.
Disclaimer risiko: seluruh konten di situs ini disediakan untuk tujuan edukasi, bukan nasihat keuangan, sinyal, ajakan transaksi, atau janji keuntungan. Trading memiliki risiko tinggi dan dapat menyebabkan kehilangan sebagian atau seluruh modal. Pelajari legalitas penyedia layanan sesuai yurisdiksi Anda.